1. Tool Introduction
Recently, during the Qi certification testing process, there was a need to use FreeMaster to observe certain variables and manually calibrate the prototype. Therefore, I have organized and shared the content related to using FreeMaster during the certification process.
1. What is FreeMaster
FreeMASTER is a user-friendly real-time debugging monitor and data visualization tool (Figure 1) that can be used for runtime configuration and debugging of embedded software applications. FreeMASTER is suitable for a wide range of automotive and industrial applications. It supports non-intrusive monitoring of variables on running systems and can display multiple variables in standard widget formats (gauges, sliders, etc.) or text form on an oscilloscope-like display, providing an easy-to-use data logger.
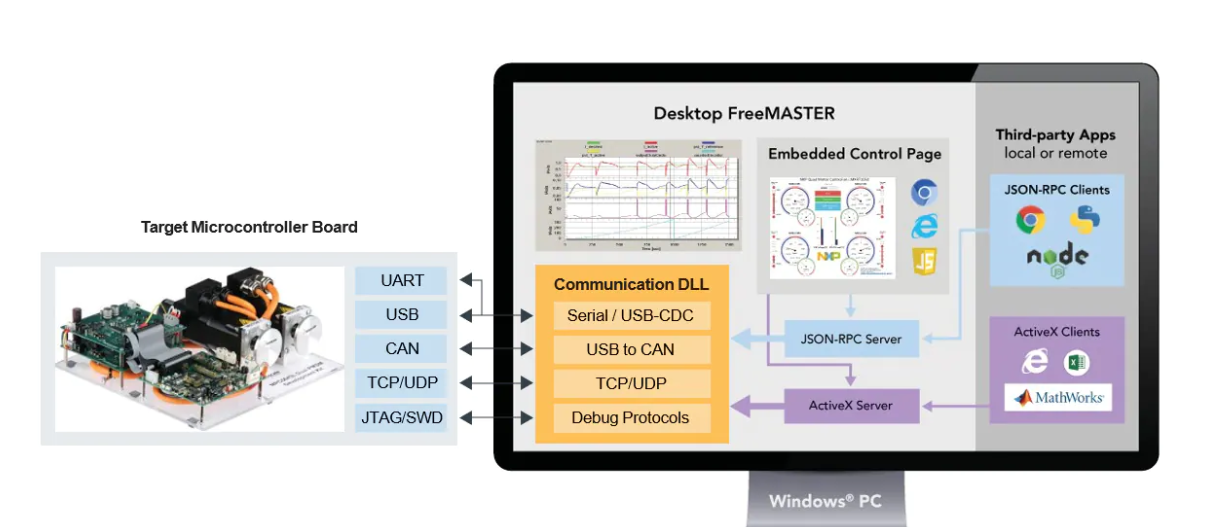
Figure 1 Desktop version FreeMASTER connection options diagram
2. FreeMaster Installation
Official download link (Figure 2)
FreeMASTER Run-Time Debugging Tool | NXP Semiconductors
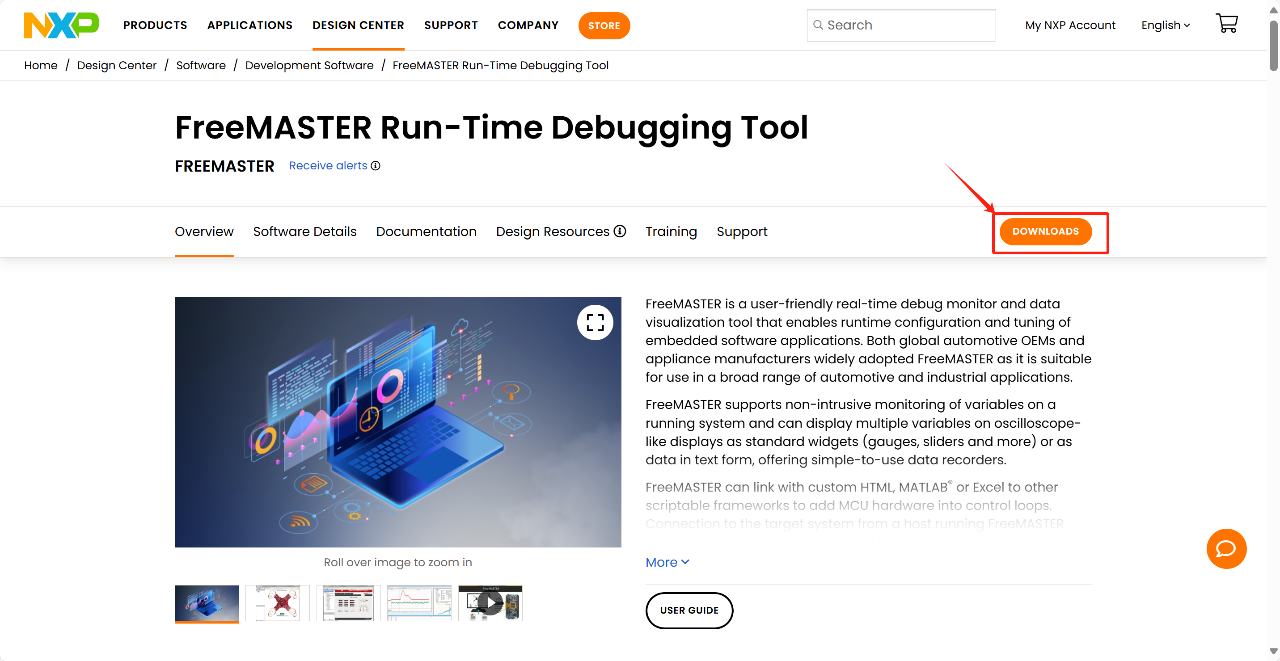
Figure 2
After navigating to the download page, click DOWNLOADS (Figure 2). Select the FreeMaster download entry, where you will find tools and drivers related to FreeMaster; be careful not to select the wrong one. For Windows, the selection is as shown in Figure 3:
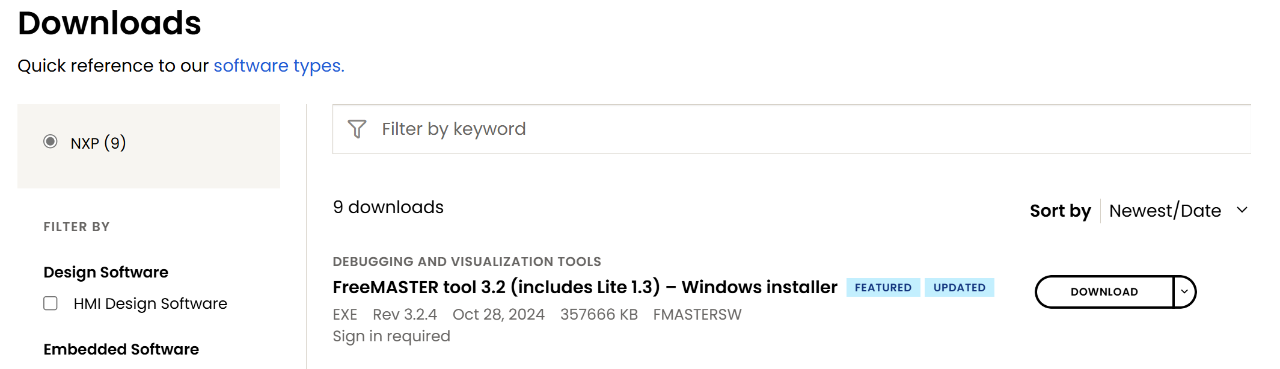
Figure 3
At this point, the NXP download agreement will pop up, as shown in Figure 4. Click agree to start the download. For installation operations, you can refer to the FreeMaster installation tutorials available online. You can also follow the installation prompts and click Next to complete the installation, which will not be elaborated here.
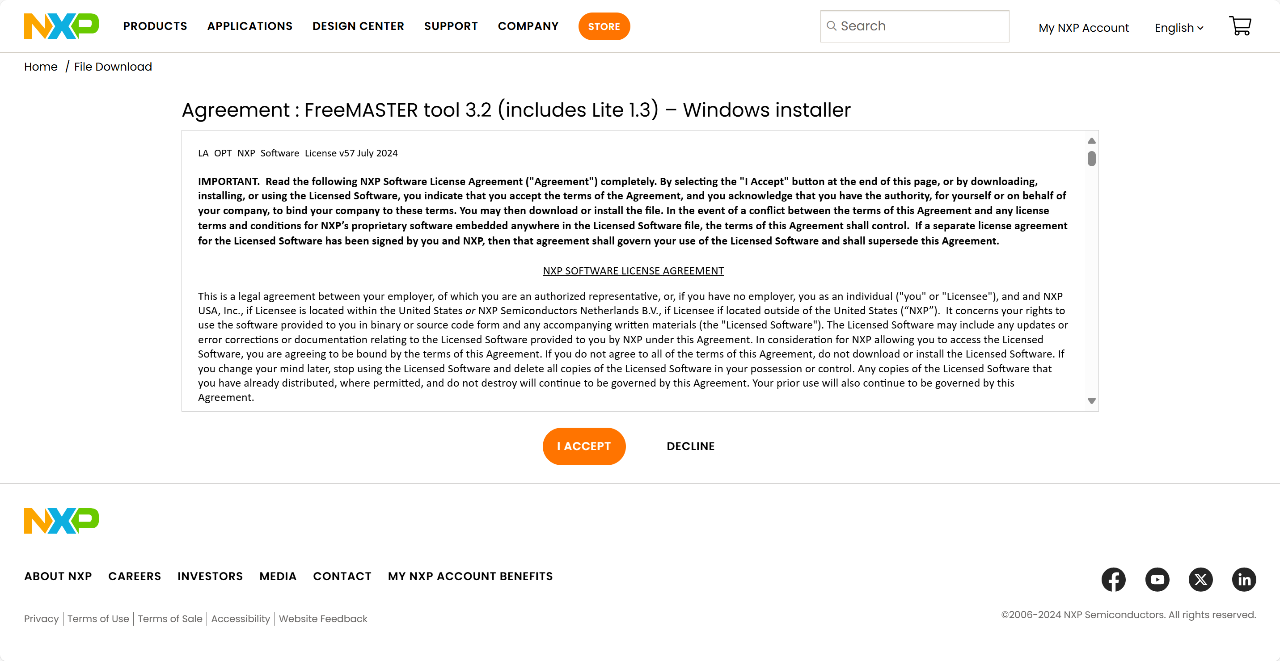
Figure 4
2. Observing Variables and Manual Calibration
1. Observing Variables:
Here, I will introduce the actual operations during the certification process. After the tool installation is complete, you can directly find the Common folder under the project directory and choose to open the file ending with .pmpx using Free Master (as shown in Figure 5) to open the tool and switch to the project interface. Close the prompt pop-up to start setting up the project.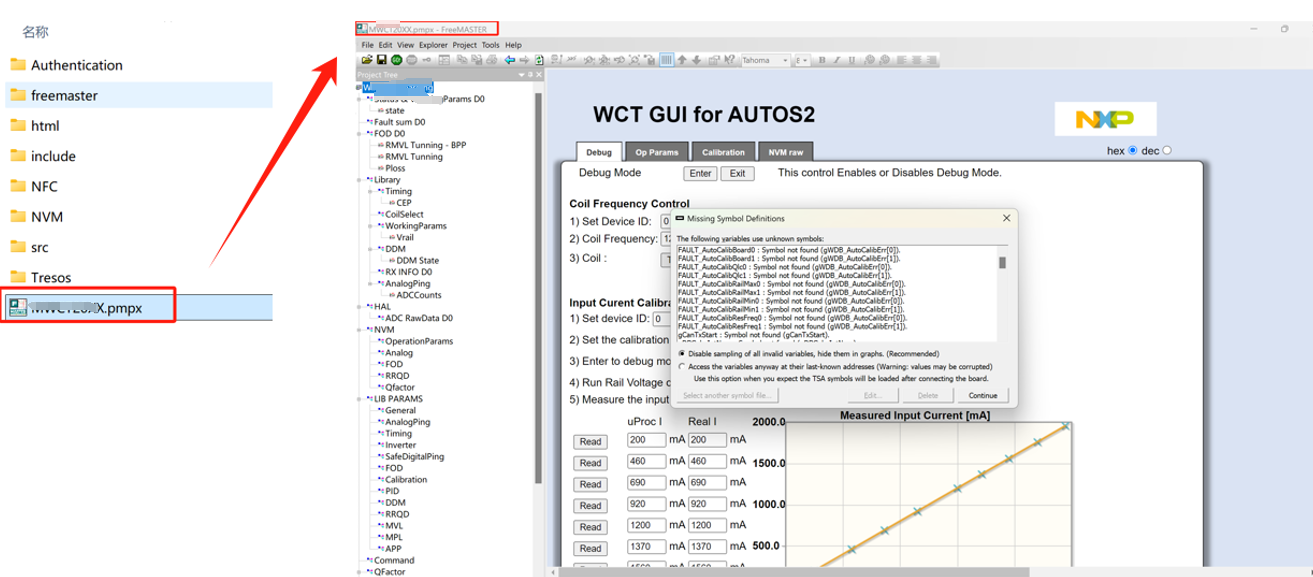
Figure 5
First, click on the Project's Options option. This time, we mainly use the Comm and MAP Files interfaces (Figure 6). The Comm interface is primarily used to select the communication method, while the MAP Files interface is used to select the corresponding executable file. The Options selection card interface is shown in the figure below. First, configure the Comm interface, selecting the communication method as Plug-in module, and open the dropdown as shown in the figure below. Since I am using the PE debugger here, just select the corresponding item. Then configure the MAP Files interface by clicking on the red box in the figure below to view the selected elf file, keeping the default settings.
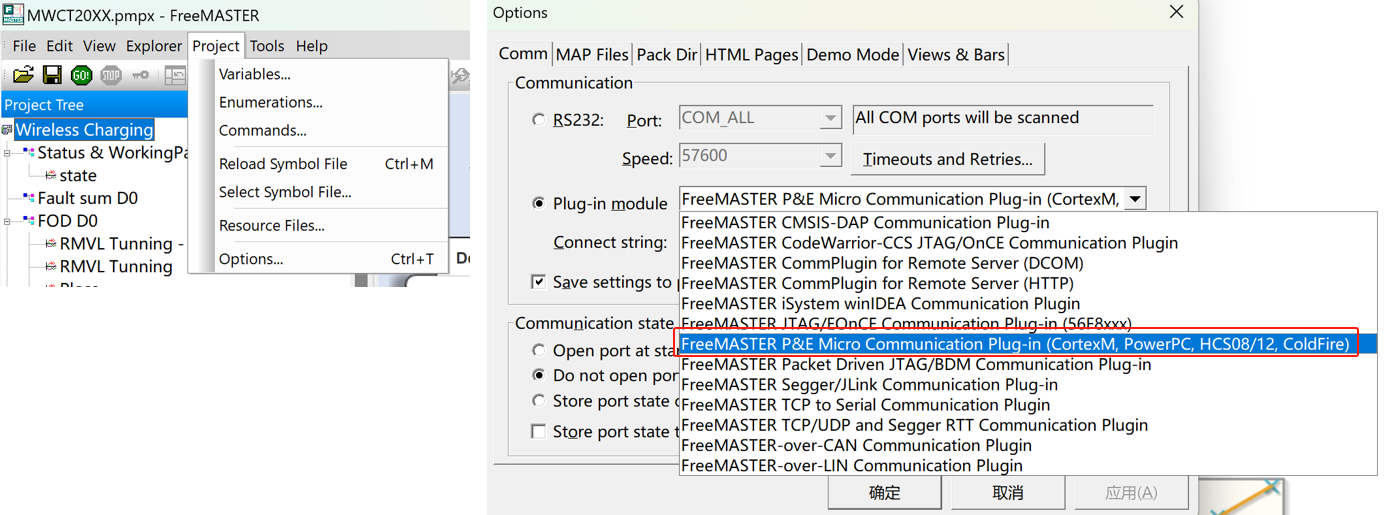
Figure 6
Open the Project's Variables option in the menu bar to enter the variable list, as shown in Figure 7 below: (You can also open the Variables option from the properties bar after creating an oscilloscope.)
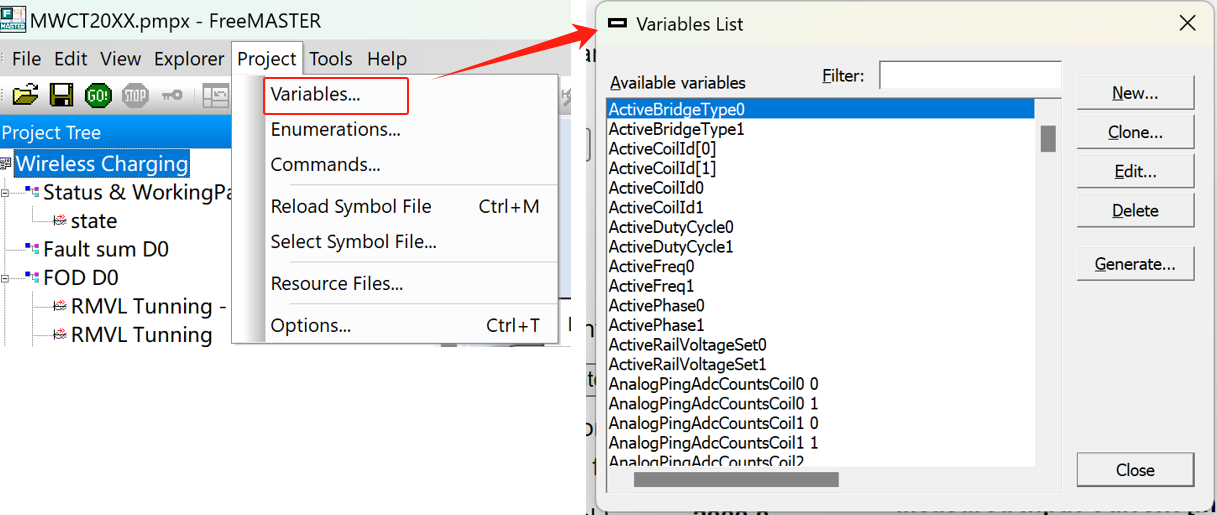
Figure 7
As shown in Figure 8 below, select Edit in the Variables list column. In the pop-up window, there is a Definition column, where you generally select the variable you want to view in the Address field. The variables here correspond to those in the code:
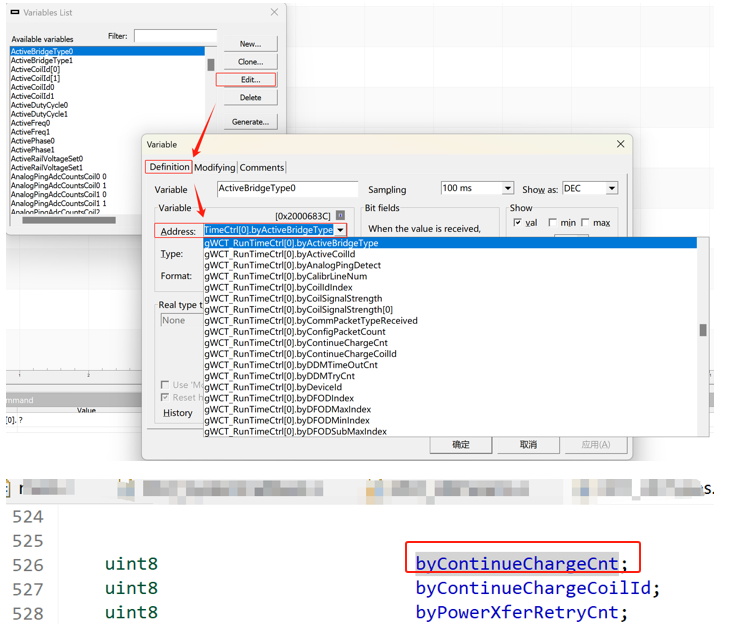 Figure 8
After adding the variable, you can further configure the variables you want to observe in the oscilloscope's properties window. The final running effect is shown in Figure 9.
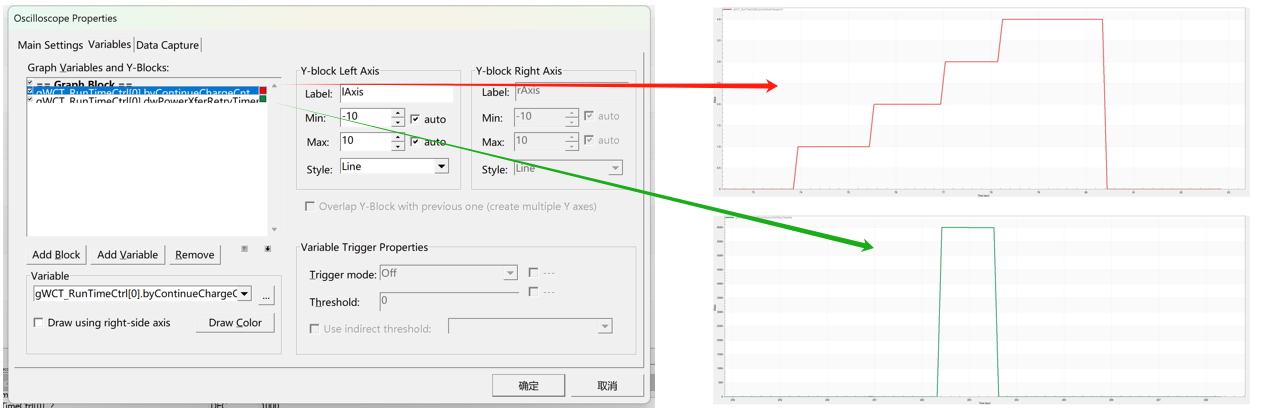
Figure 9
2. Manual Calibration:
NXP provides a conversion method, which is the automatic calibration function. When powered on for the first time after refreshing the software, the transmitter will perform automatic calibration and obtain parameters, which are then written to Flash. However, the prototype is easily affected by the environment (mainly surrounding metal objects, and the placement position must face upwards), so there is a need for manual calibration, which is also completed using the Debug function of FreeMaster.
Click the GO button and then Enter in the DEBUG window to enter the debugging state (Figure 10). At this point, the serial port will receive logs of the status transition:
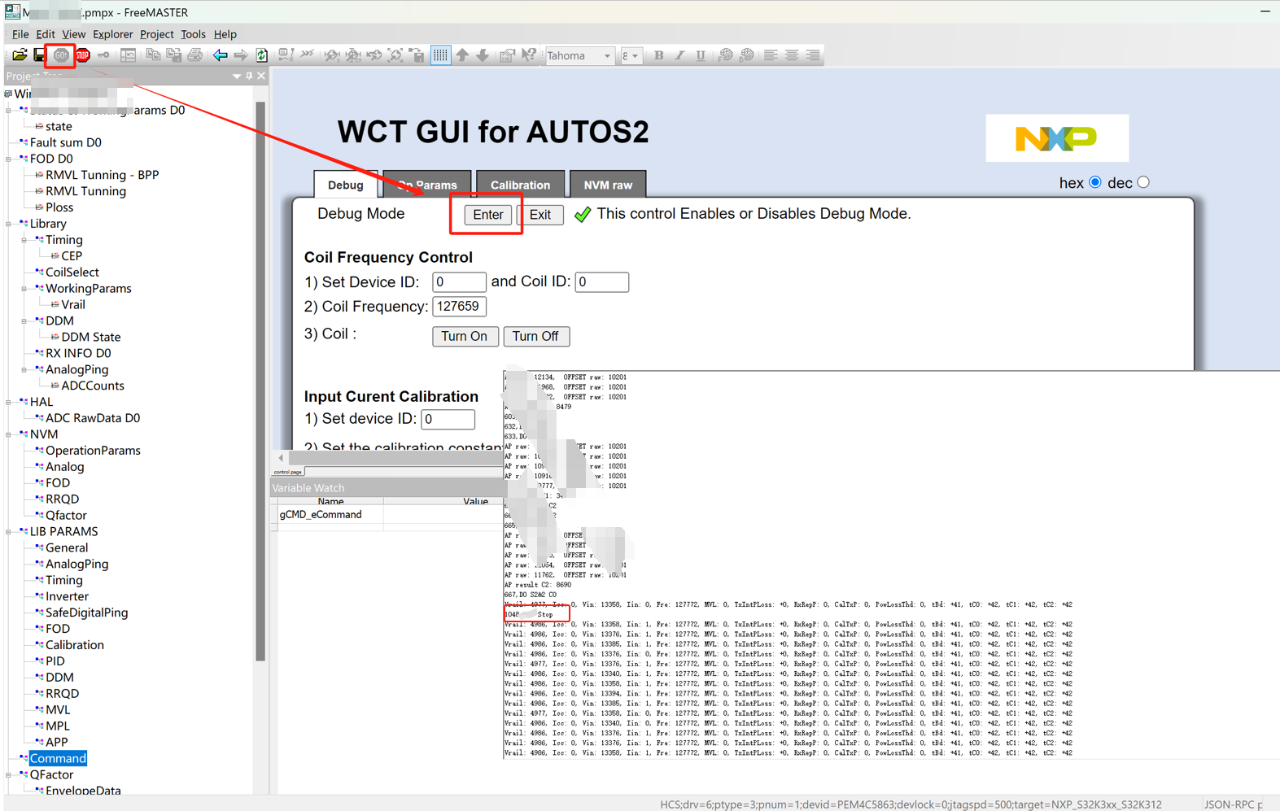
Figure 10
In the left menu bar, find the Commond item, click to select xxxCALIBRATE. Later, based on the logs, if you receive information about three coils and calibration completion (Figure 11), it indicates that the prototype has completed manual calibration, and you can then proceed with the related tests after calibration.
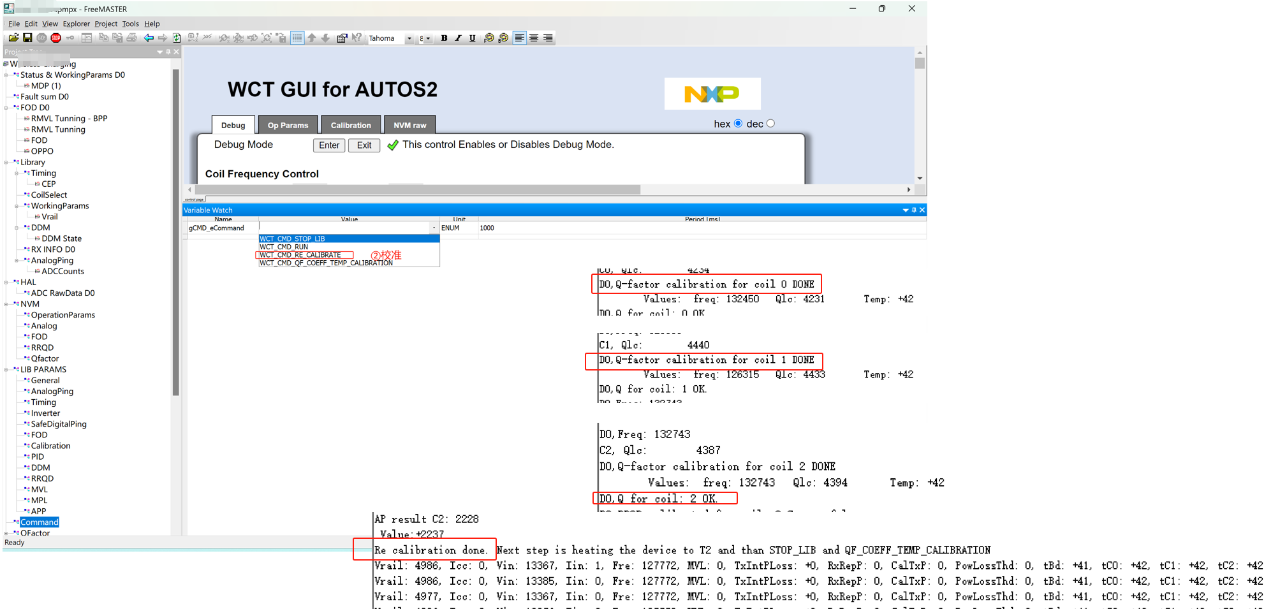
Figure 11
3. References
- 《The Most Detailed FreeMASTER 3.2 Version Installation Tutorial_freemaster Installation Tutorial - CSDN Blog》
- 《FreeMASTER Quick Start - CSDN Blog》
Feel free to leave comments below the blog post, and we will respond to your questions promptly.
For more inquiries, please contact the ATU department of WPG Holdings Group: atu.sh@wpi-group.com Author: Alan
For more information, please scan the code to follow us!